Sump Controller#
This example presents the software needed to implement a simplified pump controller that might be used in a mining environment. It is based on a case study from Burns and Wellings, Real-Time Systems and Programming Languages, Addison Wesley, 2001.
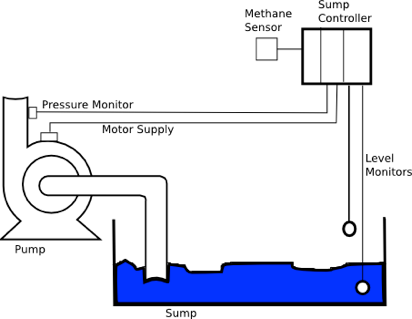
The task of the system is to pump water from a sump to the surface. There are two level monitors which start pumping if the sump is full and stop pumping if it is empty again.
Pumping should only start if the methane level is below a certain threshold. If the pump is already running and methane exceeds the threshold, it should stop automatically.
There are some additional requirements:
- After starting the pump, a pressure monitor must signal pressure within a defined time to ensure the pump does not run dry. Otherwise the pump becomes hot and finally breaks.
- When stopped, the run signal (checkback) from the motor must be absent (i.e. the contactor is open).
- When running, the checkback signal must be present.
- After a fault, a manual reset signal is necessary to restart the controller.
The controller behavior can be modeled as a flat state chart. The model below was created using ArgoUML, an open-source modeling tool. There are two main states, PumpStopped and PumpRunning. Changing from running to stopped is only possible via two intermediate states (PumpStarting, PumpStopping) that check that the pump motor checkback signal is present after a switching command. If the checkback from the motor is missing, the Error state is entered.
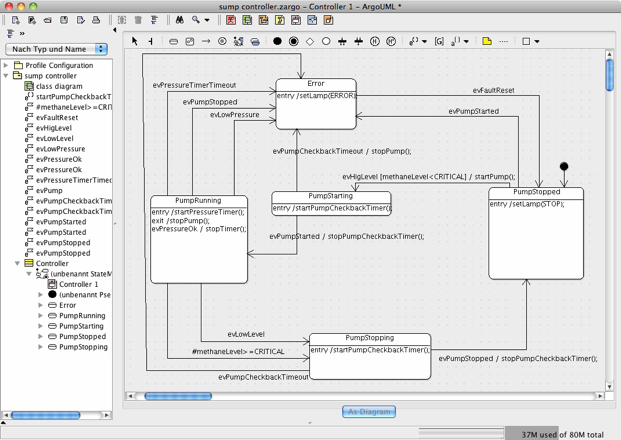
In another possible design, all states except the Error state are children of a NoError state.
To create the state machine implementation code, export the diagram to an XMI file and then call the state machine generator:
java -jar codegen.jar -S -p ARGOUML -t "sump controller:Controller" -o controller controller.xmiIn this case, the C implementation is generated. The -t flag defines the path to the state diagram within the XMI model file.
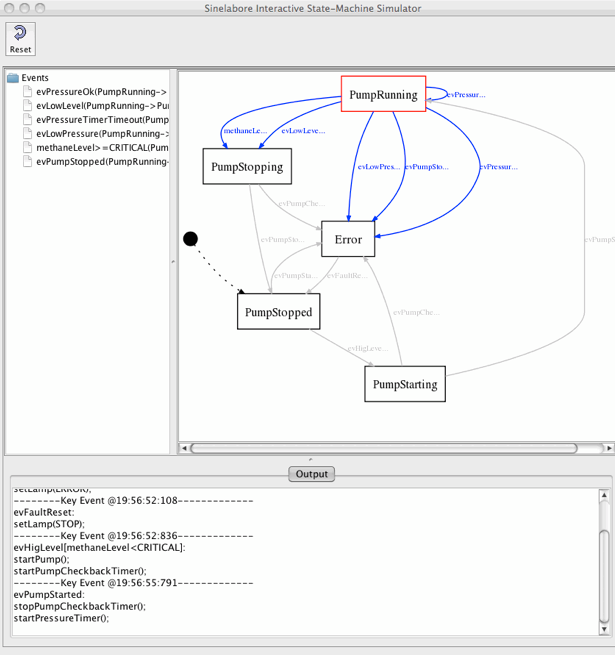
With the optional -S command line flag, the graphical simulation starts (see below). The graphical simulation allows you to send events to the machine interactively and observe both the new active state and the executed C code. The diagram below shows the state machine in the PumpRunning state. Events currently accepted by the machine are listed on the left and are shown in blue in the diagram. To trigger a transition, click an event in the list. The output window displays a trace of the executed code provided in the diagram.
It is also possible to observe a real target connected to the graphical simulation. More information on how to connect an embedded target, e.g. via a CAN communication link, is available in the Sinelabore manual. If you are interested in the model file or generated code, just send a mail to info at sinelabore dot com.