ASURO programming using state diagrams#
State diagrams describe behavior#
Watch the short video above. It shows a little mobile robot (ASURO) exploring its environment. Consider how the exploration algorithm might work.
Want to know more about this robot called ASURO? ASURO is a small, freely C-programmable mobile robot kit that was developed for educational use, especially in the DLR School Lab.
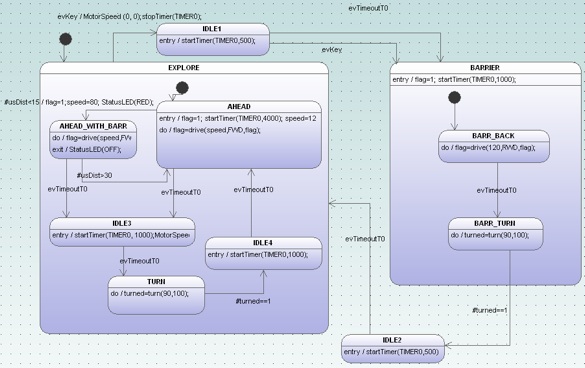
The diagram below shows the state chart of the software running on the robot. If you examine the diagram, you can clearly understand what is happening and why. This is the first major benefit of state diagrams. State diagrams are perfect for describing reactive systems.
Is this diagram really describing the software, or is it just an early design sketch that is no longer valid because it was never updated after coding started?
To make sure this does not happen, the code running on the robot was generated directly from the state diagram. This is the second major benefit. State diagrams are perfect for describing reactive systems and generating code from them. If you are interested in the ASURO code, just send us a mail.
What is going on in the robot?#
Debugging an application based on generated state machine code is a bit different from debugging handwritten state machine code. Why? Because you can assume that the generated code is correct. You do not have to worry about the implementation details of a state machine in C (e.g. handling history, hierarchical designs, placement of entry/exit code).
If the machine does not do what it should do, then most likely the model is not correct. Tracking down such issues, especially in deeply embedded real-time systems, typically means adding a tracing mechanism that shows which events fire. The code generator can support you here.
Automatic generation of trace code#
The code generator can add trace code automatically. You only have to call the generator with the -Trace command line switch. In this case, calls to a trace function are inserted in the generated code. The argument of the trace function is the processed event.
A part of the ASURO state machine is displayed below. For every handled event the trace function is called (e.g. xxxTraceEvent(2U)). If trace code is no longer needed, call the code generator again without the -Trace option.
case EXPLORE:

    switch(instanceVar->stateVarEXPLORE){

        /*
          Code for transitions starting from inner states
         */
        case AHEAD:
            /* action code  */
            flag=drive(speed,FWD,flag);

            if(usDist<15){
                behaviourTraceEvent(2U);
                /*Transition from AHEAD to AHEAD_WITH_BARR */
                evConsumed=16U;

                /*Action code for transition */
                flag=1;speed=80; StatusLED(RED);
                instanceVar->stateVarEXPLORE=AHEAD_WITH_BARR;
            }else if(msg==(BEHAVIOUR_EVENT_T)evTimeoutT0){
                behaviourTraceEvent(0U);
                /*Transition from AHEAD to IDLE3 */
                evConsumed=1U;

                /*onEntry code of state IDLE3 */
                startTimer(TIMER0, 1000);MotorSpeed(0,0);
                instanceVar->stateVarEXPLORE=IDLE3;
            }
            else
            {
                /* Intentionally left blank  */
            }
        break;
                ...
If tracing is enabled, an additional header file is generated that provides a table mapping event IDs to event strings. For example, the argument 2U from above corresponds to the second entry in the table. This allows you to display events as text.
const char* const behaviourTraceEvents[] = {
    "evTimeoutT0",
    "turned==1",
    "usDist<15",
    "usDist>30",
    "evKey"
};
The trace function must be provided by yourself. Within the trace function, you can decide what to do with this trace information:
- store it in a ring buffer and read it later (post mortem)
- display it
- forward it to a monitoring station
- …
The following code was used on the ASURO robot and simply sends the processed event to a monitoring PC.
void behaviourTraceEvent(BEHAVIOUR_EVENT_T evt){
    SerPrint(behaviourTraceEvents[evt]);
    crlf();
}
On the PC it is now possible to watch the event flow in a terminal window.
Watching events in a terminal is not good enough#
Watching events in a terminal window is helpful, but sinelaboreRT can do even better. When starting codegen.jar with the -S command line switch, an interactive graphical simulation window pops up. The state machine status after startup is displayed. The events that can currently be handled are shown in blue and are also listed in the left window. The output window shows the executed state machine code. You can send events to the machine by clicking on an event. The display is updated accordingly and shows the new status.
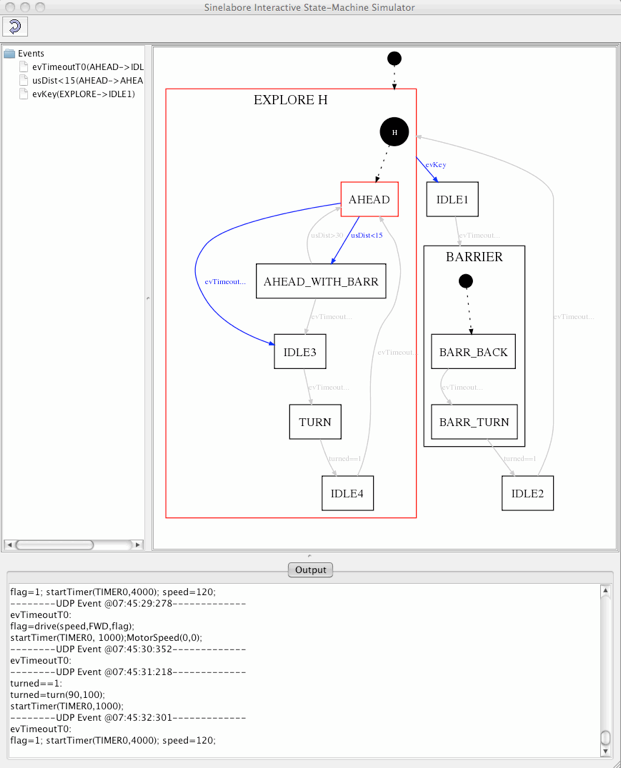
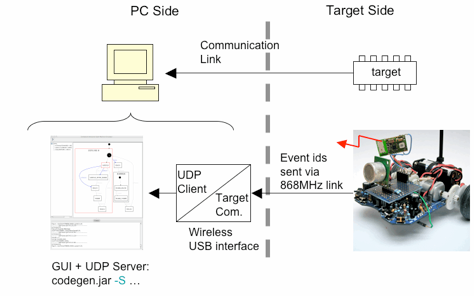
Besides the interactive mode, it is possible to send events via a UDP port. This is what we show next. A small application receives the events sent from the ASURO robot over a wireless serial link and translates them into UDP messages (see diagram below). The UDP messages are received by the simulator and the display is updated accordingly. Click on the simulation image above and watch how the state diagram is updated while ASURO is exploring its environment.
Summary#
The sinelaboreRT code generator provides several mechanisms to support debugging and testing of your state machine design.
- It can automatically add trace code to the state machine.
- It provides an interactive simulation window that can display the status of your embedded target in real time.
- With the UDP/IP interface, a flexible mechanism is available to use the communication interface your hardware offers. A simple “event forwarder” is all you need.