Using Sinelabore’s trace features to generate nice-looking state flow diagrams with Mscgen#
There are many cases where it is useful to monitor a system in real time and trace the sequence of events. In this toolbox article, we explain how to do code instrumentation and create a sequence diagram showing the exact flow of events for detailed analysis. For graphics rendering, we use Mscgen [1] The goal is to generate the following diagram more or less automatically.
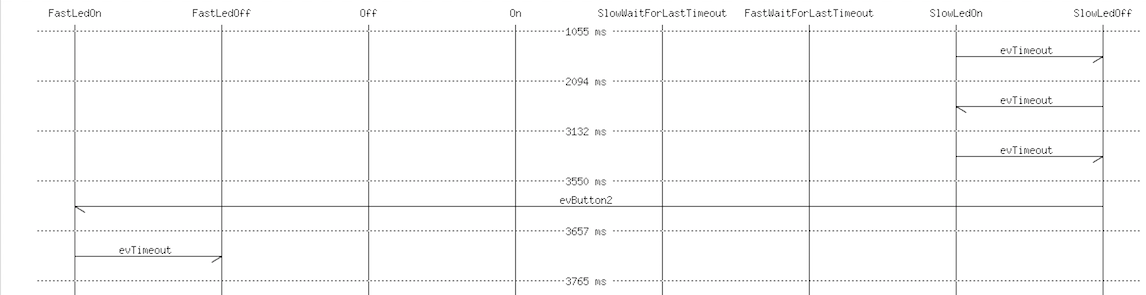
Figure 1: Example state flow generated in this article (full picture).
To make things practical, we use the EnergiaBlink example available on GitHub. To follow the steps yourself, install Energia and one of the starter kits from TI. Here, we use the EXP430F5969.
Step 1: Instrumenting your code#
As a first step, it is necessary to instrument the state machine code. Luckily, this is done automatically by the code generator. The command-line switch -Trace enables the generation of trace code. The following code snippet shows the result:
switch (stateVars.stateVar) {
  case Slow:
    switch (stateVars.stateVarSlow) {
      case SlowLedOn:
        if (msg == evTimeout) {
          /* Transition from SlowLedOn to SlowLedOff */
          evConsumed = 1;
          /* OnEntry code of state SlowLedOff */
          digitalWrite(RED_LED, LOW);

          /* adjust state variables */
          stateVarsCopy.stateVarSlow = SlowLedOff;
          StatemachineTraceEvent(0);
        } else {
          /* Intentionally left blank */
        } /* end of event selection */
        break; /* end of case SlowLedOn */
    }
}
Figure 2: Generated state machine code with the trace method call.
The relevant line is StatemachineTraceEvent(0);. Whenever this code executes, the trace method is called. The content of this trace method can be freely defined. In our case, we store the event for later usage. Figure 3 shows the required trace method. As you can see, the event is already stored in the format required by Mscgen.
String event;
void StatemachineTraceEvent(int evt) {
  event = "[ ";
  event += "label = \"";
  event += myGeneratedSM.getNameByEvent((STATEMACHINE_EVENT_T)evt);
  event += " \" ]";
}
Figure 3: Trace code automatically called from the state machine each time an event is processed.
Step 2: Writing the Mscgen text to the serial line#
Mscgen expects a specific input format and requires definitions like available states, diagram width, and so on at the beginning. This is printed once in the setup code after reset.
Serial.println("__start__");
Serial.println("");
Serial.println("");
Serial.println("msc {\n\nhscale = \"2\";\n");
Serial.println(InnermostStates);
Serial.println("");
Serial.println("");
Figure 4: Initialization code executed once after reset to print the header of the Mscgen file.
Then the code loops forever waiting for events to process (line 115). Whenever a transition is available, we ask the state machine what the current state is before execution (line 127). Then the machine is executed (line 131), and we ask again for the current state in case the event was processed (line 134 onward). If the event was not processed, this is also shown in the diagram (line 140 onward).
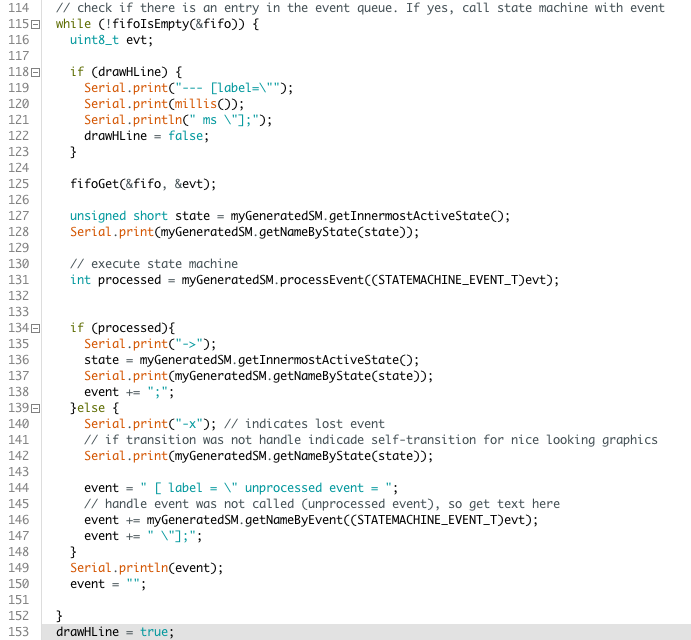
Figure 5: Manually written code generating input for Mscgen. This can be reused for each project.
Step 3: Receiving the text on the PC side and generating the image#
There are many possibilities to implement the PC-side software. The most basic way is to use a terminal program and paste the received trace code into a file. Then the file can be converted into an image:
mscgen -T png -i sc.sc -o sc.pngFigure 6: Flow diagram generation using Mscgen.
A more comfortable way is to automatically save the received trace text into a file whenever a magic pattern is received from the embedded system (for example, after restart). The following code demonstrates this and was tested on OS X, but it should also work on Linux. Full source code is available here.
Conclusions#
With the automatically generated trace code and a few manual lines of code, it is possible to generate the required input for Mscgen. Mscgen then creates clear and useful images that show event flow in a structured way. This helps track down problems more easily.
Besides finding problems, this is also a useful way to document system behavior for defined event sequences and specific test cases.
[1] Mscgen is a small program that parses Message Sequence Chart descriptions and produces PNG, SVG, EPS